
SOLID WP6 aims to evaluate the economic performance and potential of low input (LI) and organic farms to adopt novel strategies. Edition 2 of SOLID News described how a pragmatic LI definition was developed; pragmatic because the definition was developed within limited variables available through FADN data; and to fully exploit it as a tool for further analysis on the profitability of LI farms, allowing exploration of their economic potential in adopting new strategies. An EU-wide analysis has been undertaken to provide a first insight of the relative performance of organic and LI farms compared to conventional farms. In this article, we explore the more country-specific results. This article aims to identify the main differences between countries in terms of income and resilience of high and low input dairy farms to volatile milk and feed prices.
For further details on country specific results of the low input farms, we advise interested readers to read the summary of deliverable 6.1.
By Jolien Hamerlinck, Jo Bijttebier, Ludwig Lauwers and Simon Moakes
Does the low input European dairy farm exist? Based on a detailed review of existing literature on classification of farming systems and an explorative study of these methodologies on UK and Belgian data, it was concluded that a general definition of the European LI dairy farm was difficult to develop.
One of the main causes was the variety of farming systems in Europe. To fully elaborate competitiveness issues within and between the farming systems across Europe, LI farms were defined for each country as those farms with the lowest 25% expenditure on inputs for that country. The inputs taken into account to identify LI farming systems, were the
costs for fertilizers, crop protection, purchased feed for the ruminants and energy, expressed as € per grazing livestock unit. A first study of the FADN database (2007-2008), revealed that LI farms were smaller, with fewer animals, a slightly higher family
labor percentage and lower milk yields. Besides these structural differences, LI farms were less profitable than other holdings, but also received lower support payments (see summary of deliverable 6.1 for more information).
Country specific differences in performance of high input (HI) and LI dairy farms
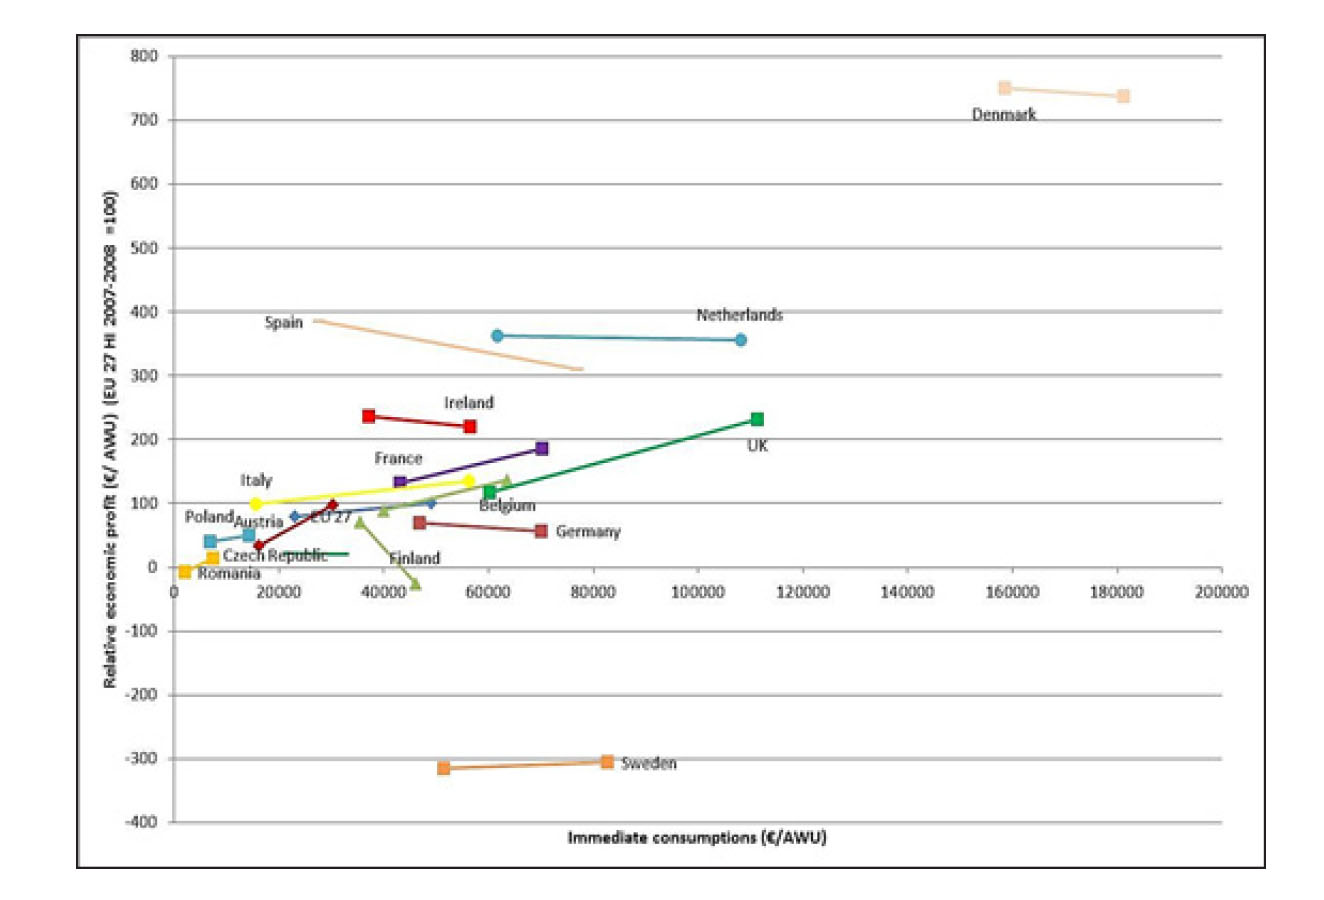
With the pragmatic country-specific definition of low input dairy farms as a tool, we can differentiate farms in each country into high versus low input farms. Figure 1 represents the average economic profit per annual working unit (AWU) for dairy farms across Europe for the years 2007-2008 (with direct input costs along the x-axis). The relative economic
profit of the farms in the different countries is compared to the economic profit of the EU 27 HI farm, e.g. the profit of a dairy farm in Denmark is more than 7 times greater than that of the EU average. In the figure, each country is represented by two dots, interconnected with a line. The left dot represents the average profit of the LI farms of that country while the right dot illustrates the average profit of the HI farm.
The length of the line indicates the relative difference in input expenditure between HI and LI; the slope indicates the difference in profit: A downward slope indicating that LI holdings perform better than HI, (which is strongly pronounced in Finland, but is also the case in Spain and Ireland) i.e. additional inputs have resulted in lower profitability. In several other countries however the line slopes upward; HI farms have higher economic
profits compared to the LI farms. The position in the figure demonstrates very clearly the variety in farm size of the different farming systems within Europe. The immediate expenditures for a LI farm in Denmark, for example, are 10 times higher than those for a LI farm in Italy, reflecting the variation in dairy systems across the EU. These data reveal further insights on the real behavior of LI farms: some belong indeed to another farming system, while other LI farms, like in the Netherlands and Denmark, may still belong to a similar production system but are more efficient than the HI farms in their country.
Are LI farms more resistant to future volatility of milk and feed prices compared to HI farms?
Due to current and future tendency of high volatility of milk, feed and energy prices, the resilience of LI and HI dairy farms to this volatility is of interest.
Figure 2 illustrates this volatility for milk prices in Europe and Belgium. Two sensitivity analyses have been undertaken based on two observations in the milk price evolution.
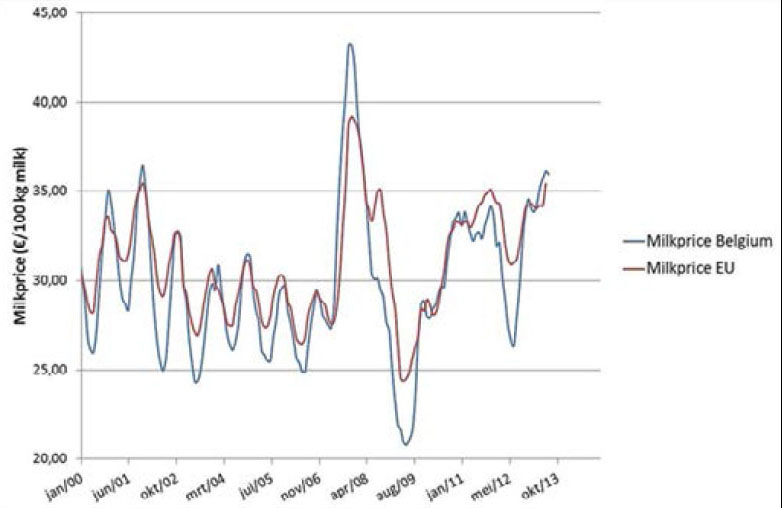
First, the average milk price during a longer period (2007-2012) is lower compared to that of the period 2007-2008, though the recent trend is again upwards. Secondly, there are significant changes, illustrated by the high milk price in 2008 and the pronounced decline
in the following year 2009.
For 2007 – 2012, milk prices declined by approximately 5.5% and yet feed prices increased by about 3% in comparison with the period 2007-2008. In 2009, milk prices
were very low and declined by 30% while feed prices only declined by 13 %. Based on these figures, we designed a trend and a shock scenario, (based upon FADN data results from 2007-2008) to simulate the effect of both scenarios. Table 1 summarizes the average economic performances of LI and HI dairy farms in EU27 in 2007-2008 compared to the scenario simulations of reduced longer term prices and a price drop shock scenario.
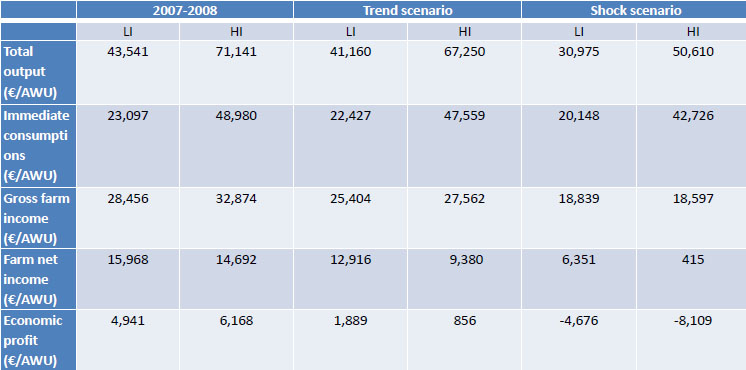
The results show that LI farms are more resilient towards price fluctuations than HI farms. Where HI farms had a higher economic profit in 2007-2008, they have a lower
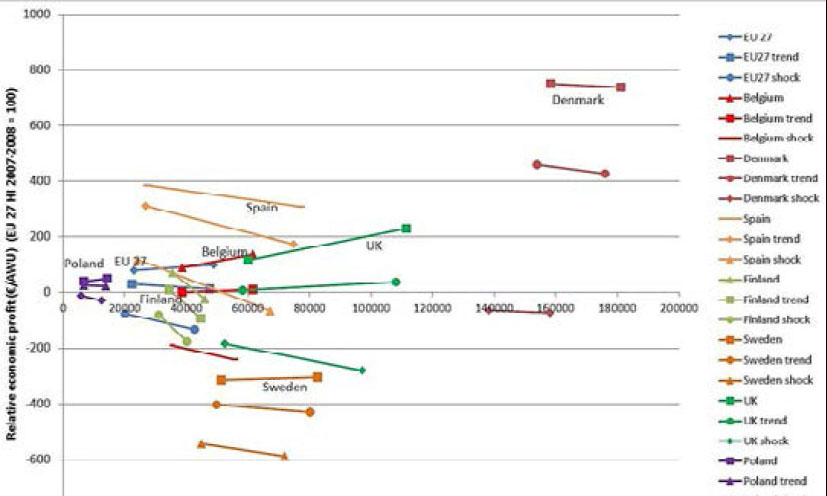
income when assuming trend conditions and were more affected by extremely low prices as those observed in 2009. These results are confirmed by the country specific data (Figure 3). When prices decline, either in the long or short term, the economic advantage of HI farms decreases in these countries where HI farms perform better and in countries where LI farms perform better; this comparative advantage increases when prices decline.
Conclusions
Earlier analysis of LI farms across Europe revealed lower profitability of the LI farms compared to the high input ones. However, although this tendency can be extended to several European countries, the opposite is true for some countries; LI farms perform better than HI farms. Although their lower use of inputs produces less output, lower inputs may result in increased efficiency in the use of fertilizer, crop protection, feed, and energy on these farms. Moreover, in all European countries, LI farms seem to be more resistant to price fluctuations, which become more and more important in the post quota era, and may be of particular relevance to family farms where reduced income fluctuation is as important as absolute profit.