SOLID WP6 aims to evaluate the competitiveness of existing dairy farms and novel strategies taking actual farm and market conditions and regional resource constraints into account.
By Simon Moakes, Institute of Biological, Environmental and Rural Sciences (IBERS), Aberystwyth University, Wales
To compare the economic and physical structure of organic, low input and conventional dairy farms we are using European farm economic data (FADN). This will allow us to report the size, profitability and other characteristics of the sector, and to identify the best performing holdings. Within the data, organic and conventional farms are clearly identified, but before any analysis could be undertaken it was necessary to develop a classification to define low input dairy farms.
A more specific classification was needed
We required a method to allow the comparison of low-input dairy systems with organic and conventional farms that could be used within the data constraints of variables available within the FADN database. An initial review of previous work identified that previous projects such as IRENA, SEAMLESS and CEAS had tried to classify farms systems according to their intensity or type of dairy system. After testing these methodologies with national data in UK (ABER) and Belgium (ILVO) and following feedback from project partners and stakeholders, it was clear that although useful that
a more specific classification was needed for use within SOLID.
The cut-off value should be higher
The IRENA project used costs for fertiliser, crop protection and purchased concentrate feed per hectare as an indication of farming intensity (and potentially therefore
environmental impact), but the cut-off value for defining low input (<€80/ha) were very low compared to the values for EU dairying. Therefore it was felt that the cut-off value should be higher and that additional inputs, such as energy costs and other purchased feed should also be included. Following further testing and consultation it was agreed that the low input definition would include costs for fertiliser, crop protection, purchased feed for ruminants and energy costs (e.g. fuel and electricity).
Inputs per grazing livestock unit
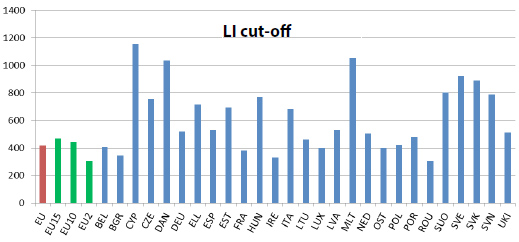
These input costs would need dividing by the number of cows, sheep/goats, livestock units (LU) or by area e.g. hectares. Due to a lack of area data for some countries due to common or shared grazing, it was decided that inputs per grazing livestock unit (GLU) would be the preferable denominator. The cut-off values specified by IRENA were very low compared
to the values of most dairy holdings, therefore it was also decided that holdings in the bottom 25% of input expenditure would be classified as LI. The 25% cut-off value for all EU dairy holdings was calculated at €419/GLU for dairy cow holdings and at €359/GLU for sheep/goat holdings. Values were also calculated per country as there was large variability in input costs, as shown in Figure A below.
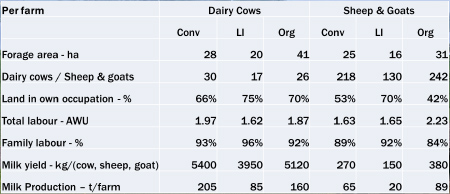
Dairy holdings were split into three groups for the analysis; organic, low input and conventional systems. Initial results indicating the structure of dairy farming in the EU is shown in Figure B below, and highlights that low input classified holdings were smaller, with less livestock, a slightly higher family labour percentage and lower milk yields.
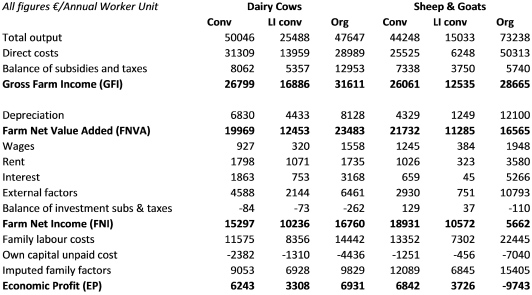
LI classified holdings had lower output
Figure C indicates that LI classified holdings had lower output and despite lower costs, their profitability was almost half that of than organic and conventional farms.
Comparison of different classes
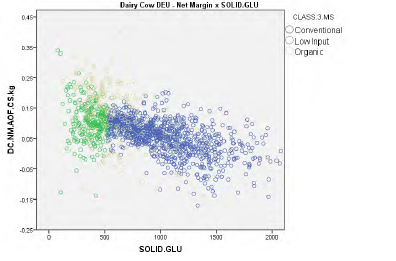
Following further statistical analysis the different classes can be compared for efficiency of input use for both physical yield e.g. milk yield per head or financial performance e.g. profit per cow or worker unit. Figure D below shows increasing net margin (NM) per kg of
milk against increasing inputs (fertiliser, crop protection, feed and energy) for German dairy cow holdings (LI holdings – green, conventional – blue and organic – cream). The figure indicates that organic systems achieved the highest NM and that despite lower
overall farm profitability LI systems resulted in high NM per milk kg. It also indicates the large variation in performance with some holdings in each class losing money for every kg of milk produced.
Conclusion and next step
In conclusion, it was possible to identify low input conventional dairy holdings
through their expenditure on a range of inputs, to allow us to compare their
performance against other farm groups. Initial analysis at EU level indicates LI
system profitability is below that of organic and conventional systems, but that efficiency may be higher.
The next step is to identify the characteristics of more profitable holdings and efficiency analysis will highlight optimum input output values that achieve maximum financial
returns. Economic analysis will then be discussed with environmental results to provide an integrated policy output on optimising the sustainability of EU dairy systems.